Research, Articles, Design
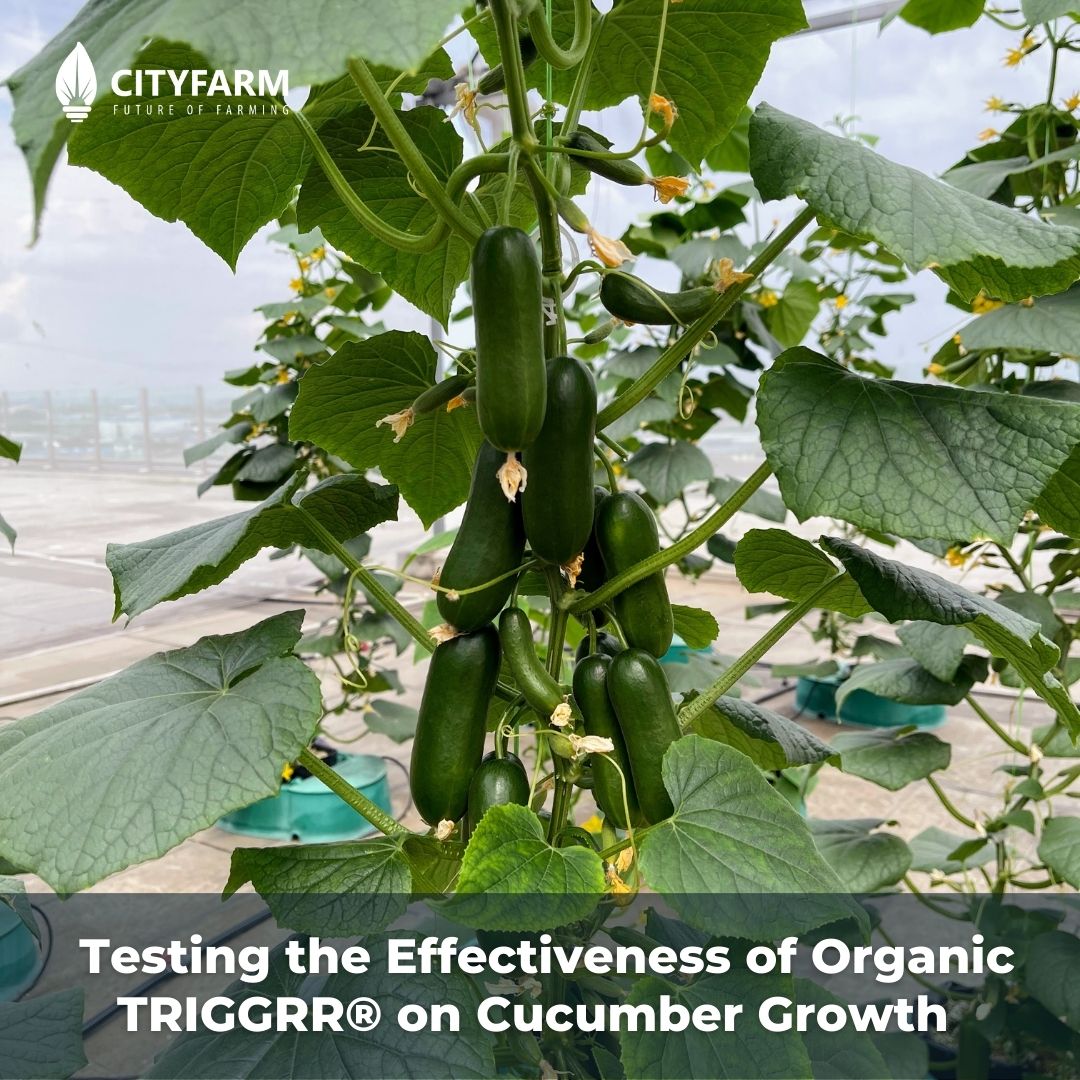
Testing the Effectiveness of Organic TRIGGRR® on Cucumber Growth
Objective
To evaluate the impact of Organic TRIGGRR® on the growth, yield, and health of cucumber plants in an urban farming environment.
Materials
1. Cucumber seeds (Rijk Zwaan Cengal) 2. Organic TRIGGRR®
3. Perlite
4. Autopot system
5. Measuring equipment (ruler, scale)
6. A&B Fertilizers
7. EC meter
9. Growth monitoring tools (camera, notebook for recording observations)
Experimental Setup
1. Sample Groups:
- Control Group: Cucumber plants grown without Organic TRIGGRR®.
- Treatment Group 1: Cucumber plants treated with Organic TRIGGRR® as a foliar application.
2. Replication: Each group will have 12 plants.
Methodology
1. Seed Germination:
- Germinate cucumber seeds in a controlled environment to ensure uniformity in seedling size.
2. Transplanting:
- Transplant seedlings into Autopot system in polybag filled with perlite.
3. Application of Organic TRIGGRR®:
- Foliar Application: Apply Organic TRIGGRR® at the rate of 1ml diluted in 1000ml of water.
Apply every week. Make sure the plants are fully drenched.
4. Growth Monitoring:
- Measure plant height, number of leaves, and leaf area every week. - Observe and record any signs of disease or pest infestations.
- Weigh the total yield (fruit weight) at the end of the growing period.
5. Nutrient and Water Management:
- Ensure consistent watering schedules for all groups.
- Test EC regularly to maintain optimal conditions for cucumber growth (adjust EC to 1.8-2.0 if necessary).
Data Collection
1. Growth Parameters: Record weekly measurements of plant height, leaf number, and leaf area.
2. Yield Data: Measure and record the total fruit yield per plant at the end of the experiment. 3. Health Assessment: Note any occurrences of diseases, pest infestations, and overall plant vigor.
Expected Outcomes
- Increased growth rate in cucumber plants treated with Organic TRIGGRR®. - Higher yield in terms of both quantity and weight of cucumbers.
- Improved plant health and resistance to diseases and pests in treated plants.
Timeline
- Week 1: Seed germination and initial growth
- Week 2: Transplanting and first application of Organic TRIGGRR®
- Week 3-9: Regular application of Organic TRIGGRR® and data collection
- Week 10: Final data collection and analysis
Conclusion
This experiment will provide insights into the effectiveness of Organic TRIGGRR® on cucumber growth in an urban farming setup. Positive results could lead to recommendations for its use in enhancing urban agricultural practices.
- Aiman Malik (University of Nottingham Malaysia)
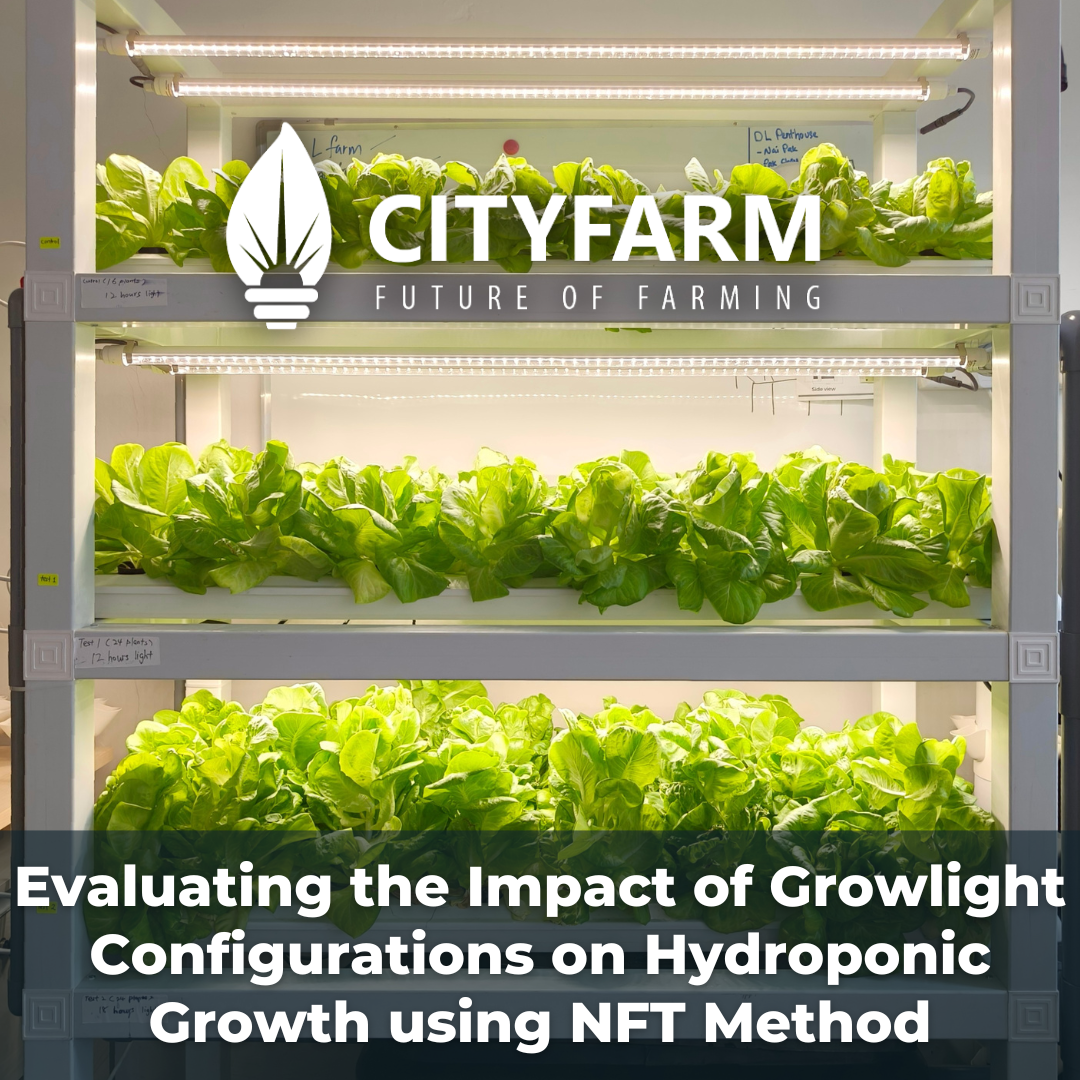
Evaluating the Impact of Growlight Configurations on Hydroponic Growth using NFT Method
Experiment Title
Evaluating the Impact of Growlight Configurations on Hydroponic Growth using NFT Method
Objective
To investigate the effects of different growlight configurations on the growth of plants in hydroponics using the Nutrient Film Technique (NFT) method.
Hypothesis
Increasing the number of growlights in conjunction with NFT channels will positively impact plant growth compared to the control group
Materials
- 4ft T8 LED growlights (Power: 25W)
- 4ft NFT channels (capable of hosting 8 plants each)
- Hydroponic nutrient solution
- Deangelia RZ lettuce seedlings
- Timer
- Measuring instruments (for growth metrics such as height, leaf count, and biomass)
- Data recording sheets
Experimental Setup
1. Control Group (C):
- Two units of 4ft growlights and two units of 4ft NFT channels.
- Growlights are set to operate for 12 hours per day.
2. Test 1 Group (T1):
- Two units of 4ft growlights and three units of 4ft NFT channels.
- Growlights are set to operate for 12 hours per day.
3. Test 2 Group (T2):
- Two units of 4ft growlights and three units of 4ft NFT channels.
- Growlights are set to operate for 18 hours per day.
|
Group |
Total plants |
Power (Wh) per day |
Power (Wh) per plant per day |
|
Control (C) |
16 |
600 |
37.50 |
|
Test 1 (T1) |
24 |
600 |
25.00 |
|
Test 2 (T2) |
24 |
900 |
25.00 |


Experimental setup, from top to bottom: Control group, Test 1 group and Test 2 group.
Experimental procedure
1. The NFT channels were prepared according to manufacturer instructions and filled with hydroponic nutrient solution.
2. The lettuce seedlings were planted in the NFT channels with consistent spacing and placement.
3. The growlights were installed at an optimal height above the NFT channels to provide uniform light distribution.
4. Timers were set up to regulate the light cycles for each group as per the experimental conditions.
5. Environment conditions such as temperature, humidity, and nutrient levels were monitored and maintained throughout the experiment to ensure consistency.
6. Plant height, leaf count, and biomass of lettuce were measured and recorded weekly for each group.
7. Visual inspections were conducted to check for any signs of stress, nutrient deficiencies, or other abnormalities in plant growth.
8. Measurements and observations were repeated weekly over the duration of the experiment.
Data Analysis
- Average
- Average height
|
|
Week 1 |
Week 2 |
Week 3 |
Week 4 |
Week 5 |
Week 6 |
|
C |
3.83 |
4.97 |
6.60 |
10.33 |
13.79 |
14.73 |
|
T1 |
4.17 |
4.79 |
7.21 |
11.50 |
14.47 |
15.66 |
|
T2 |
4.03 |
5.10 |
7.04 |
11.37 |
15.02 |
18.87 |

- Average leaf count
|
|
Week 1 |
Week 2 |
Week 3 |
Week 4 |
Week 5 |
Week 6 |
|
C |
4.94 |
9.25 |
13.31 |
18.81 |
24.75 |
32.81 |
|
T1 |
5.08 |
8.83 |
13.21 |
19.21 |
25.46 |
31.54 |
|
T2 |
5.08 |
9.21 |
13.67 |
22.25 |
31.17 |
40.58 |

- Average biomass
|
|
Week 1 |
Week 2 |
Week 3 |
Week 4 |
Week 5 |
Week 6 |
|
C |
15.88 |
18.56 |
22.50 |
34.50 |
53.81 |
85.00 |
|
T1 |
15.54 |
19.08 |
23.21 |
35.92 |
55.08 |
78.50 |
|
T2 |
15.83 |
20.00 |
26.63 |
47.29 |
73.92 |
115.50 |

- ANOVA
The tables below shows whether there are significant differences between the groups, which are determined by using ANOVA and pos-hoc test.
- Height between groups
|
|
Week 1 |
Week 2 |
Week 3 |
Week 4 |
Week 5 |
Week 6 |
|
C vs T1 |
no |
no |
no |
yes |
yes |
yes |
|
T1 vs T2 |
no |
no |
no |
no |
no |
yes |
|
T2 vs C |
no |
no |
no |
no |
yes |
yes |
- Leaf count between groups
|
|
Week 1 |
Week 2 |
Week 3 |
Week 4 |
Week 5 |
Week 6 |
|
C vs T1 |
no |
no |
no |
no |
no |
no |
|
T1 vs T2 |
no |
no |
no |
yes |
yes |
yes |
|
T2 vs C |
no |
no |
no |
yes |
yes |
yes |
- Biomass between groups
|
|
Week 1 |
Week 2 |
Week 3 |
Week 4 |
Week 5 |
Week 6 |
|
C vs T1 |
no |
no |
no |
no |
no |
no |
|
T1 vs T2 |
no |
yes |
yes |
yes |
yes |
yes |
|
T2 vs C |
no |
yes |
yes |
yes |
yes |
yes |
Observation and Discussion
- Impact on height
From week 1 to week 3, there is no significant difference in height between the groups. Starting from week 4 until week 6, Test 1 group (three NFT channels) is significantly taller than Control group (two NFT channels). The reduced spacing between NFT channels decreased the power per plant per day, causing the lettuce to grow higher to compete for light. On week 6, Test 1 group is 0.93cm taller than the Control group.
Test 2 group have three NFT channels, but the light duration increases from 12 hours to 18 hours per day. It is significantly taller than Test 1 group by 3.21cm on week 6. When compared to the Control group, Test 2 group is significantly taller from week 5 to week 6 by 4.14cm. This means that increasing light duration from 12 hours to 18 hours only compensate for the reduced power per plant per day up until week 4. After week 4, the 18 hours of light per day had caused early bolting in the lettuce. This can be observed in Test 2 group with noticeable longer internodal length compared to the other groups.

Lettuce in Test 2 group on week 6, the intermodal length is longer than the other groups
- Impact on leaf count
The addition of an extra NFT channel in Test 1 group does not result in any significant difference in leaf count compared to Control group. On the other hand, Test 2 group with longer light duration has significantly more leaves than the other groups starting from week 4. On week 6, Test 2 group has 8 more leaves compared to Control group and 9 more leaves compared to Test 1 group. The longer period of light for photosynthesis produces more energy and resources which results in higher leaf production. However, the leaves were showing stress symptoms, and the growth was stunted.
- Impact on biomass
There is no significant difference between the biomass of the Control group and Test 1 group. Test 2 group is significantly heavier than both the Control group and Test 1 group since week 2. At week 6, Test 2 group is 30.5g heavier than Control group and 37g heavier than Test 1 group. The longer light duration resulted in more production of energy by photosynthesis and accumulation of resources.

Condition of lettuce on week 6,
Test 2 group at the bottom level is noticeably larger compared to the other groups
- Abnormalities in plant growth
In the graph of average height, the trend shows that the height of lettuce in Test 2 group increase steadily while Control and Test 1 group follows sigmoid growth curve. The height anomaly in Test 2 group is likely due to 18 hours of light per day instead of 12 hours which caused the lettuce to bolt early on week 5. Test 2 group also started to show stress symptoms from week 3. The observed stress symptoms are tip burns, leaf curling and thickening and stunted growth of leaf blade.


Stress symptoms observed in Test 2 group on week 3 (left) and week 5 (right).
Conclusion
Comparing Test 1 group with Control group, adding an NFT channel significantly increases lettuce height by 0.93cm. However, it does not make any significant difference in terms of leaf count and biomass. The growlight configuration in Test 1 group does not causes any visual difference compared to the Control group.
Comparing Test 2 group with Control group, increasing light duration from 12 hours to 18 hours per day significantly increase the height of lettuce by 4.14cm and caused early bolting. It also increases the leaf count by 9 and increases the biomass by 37g but with severe stress symptoms and stunted growth of the leaves. The growlight configuration in Test 2 group resulted in lettuce that are not aesthetically pleasing which reduces its market value.
In conclusion, increasing the number of growlights in conjunction with NFT channels will negatively impact plant growth compared to the control group.
Implications for optimizing hydroponic systems and suggest potential areas for further research
Firstly, this experiment revealed that while increasing the number of NFT channels (Test 1) did not notably affect lettuce leaf count and biomass compared to the control group, extending the light duration (Test 2) from 12 to 18 hours per day significantly enhanced plant height, leaf count, and biomass. These findings underscore the significant role of light duration in optimizing growth metrics, although prolonged exposure to light (18 hours) also resulted in early bolting and stress symptoms in the plants. Hence, further research is needed to explore optimal light intensities and durations tailored to specific plant species and growth stages in hydroponics. This may involve investigating dynamic lighting strategies or variable light schedules to effectively manage stress and further optimize growth conditions.
Next, in terms of power consumption efficiency, both Test 1 and Test 2 groups maintained the same power per plant per day, although Test 2 consumed more total power due to extended light durations. This underscores the critical need for efficiency in power consumption as hydroponic operations scale up. So, for further research should explore energy-efficient lighting solutions and their influence on growth parameters. This could involve optimizing LED spectrums tailored to different plants' specific needs and integrating smart lighting controls to adjust intensity and duration dynamically. These advancements could enhance productivity while minimizing energy costs, contributing to sustainable and economically viable hydroponic farming practices.
Besides, the Test 2 group in the experiment displayed evident stress symptoms including tip burns, leaf curling, and stunted growth, attributed to prolonged exposure to light. Despite observing higher biomass and leaf count, these benefits came at the expense of compromised aesthetic quality and market value of the lettuce. Thus, further research is essential to develop effective strategies for managing plant stress under prolonged light exposure. Potential approaches could include supplementing with stress-relief nutrients or optimizing the light spectrum to mitigate photoinhibition. These efforts aim to sustain plant health and enhance overall crop quality in hydroponic systems, addressing the challenges posed by extended light durations on plant physiology and marketability.
- Chai Wen Lin (UPM), Ngu Iee Ling (UPM)
![[Research] The Effect of Synthetic Fertilizer and Organic Fertilizer on Plant Growth (Green ribbon)](http://cityfarm.my/cdn/shop/articles/11_69_1400x.png?v=1696511389)
[Research] The Effect of Synthetic Fertilizer and Organic Fertilizer on Plant Growth (Green ribbon)
INTRODUCTION
Cityfarm Malaysia contain 2 different type of fertilizer mainly the synthetic fertilizer which is composed of the Fertilizer A&B and the organic fertilizer which contain seaweed extracts.In hydroponic cultivation, plants require significant quantities of the three primary macronutrients, namely nitrogen, phosphorus, and potassium. Additionally, they also require the following essential micronutrients: calcium, magnesium, sulfur, iron, manganese, copper, zinc, molybdenum, boron, and chlorine(Sánchez, 2023).
As the trend shifts towards organic farming, an increasing number of individuals are opting for organic fertilizers when cultivating their crops. However, there exists a common concern among farmers and gardeners that using organic fertilizers may not yield the same results as synthetic fertilizers. Their concerns include not having the same yield, quality, size as well as overall health of the vegetables is not as good as compared to vegetables planted using synthetic fertilizers.
To address this issue, CityFarm Malaysia has initiated a small-scale experiment aimed at scrutinizing the disparities in the growth of vegetables, with a primary emphasis on the Green Ribbon lettuce, when nurtured using synthetic and organic fertilizers.
METHODOLOGY
To commence this experiment, we selected "green ribbon" vegetables, which were initially planted on 10/7/2023, making them approximately 3-4 weeks old at the outset. We established two distinct Nutrient Film Technique (NFT) systems, each equipped with its own water tank containing a different type of fertilizer. Specifically, System A was supplied with organic fertilizer, while System B received synthetic fertilizer, denoted as Fertilizers A&B. The duration of the experiment spanned approximately 5 weeks, culminating in the harvesting phase. Throughout this period, we meticulously recorded the weight, height, and leaf count of each vegetable on a weekly basis.

To ensure consistent conditions, we maintained nearly identical Electrical Conductivity (EC) values in both tanks. Additionally, we aimed to keep the pH levels within the range of 5.5 to 6.5. However, an unforeseen pH drop occurred in the organic tank due to the introduction of mosquito bti. The pH dipped to approximately 4, prompting us to rectify the situation by employing calcium carbonate powder to raise the pH back within the desired range. The data collected is then tabulated and a paired T-test is then run in order to identify if there is significant difference between the 2 batches of vegetables growing from synthetic and organic fertilizer.
RESULT
Table 1 Raw data for the weekly measurement for weight,height and leave number for the lettuce
| Average Weight (g) | Average Height (cm) | Leaf Number | ||||
| Row A | Row B | Row A | Row B | Row A | Row B | |
| 1 | 21 | 20 | 2.8 | 2.2 | 8 | 5 |
| 2 | 21 | 20 | 3.0 | 2.1 | 7 | 6 |
| 3 | 20 | 20 | 4.0 | 2.5 | 5 | 5 |
| 4 | 21 | 18 | 3.5 | 2.1 | 7 | 7 |
| 5 | 21 | 19 | 3.0 | 3.1 | 6 | 4 |
| 6 | 22 | 18 | 3.3 | 4.0 | 5 | 5 |
| 7 | 22 | 20 | 3.2 | 3.5 | 7 | 7 |
| 8 | 21 | 18 | 3.0 | 2.5 | 7 | 5 |
| 9 | 23 | 18 | 2.0 | 3.5 | 6 | 5 |
| 10 | 22 | 19 | 2.7 | 2.5 | 5 | 6 |
| 11 | 20 | 20 | 4.2 | 2.4 | 4 | 4 |
| 12 | 20 | 20 | 3.1 | 3.0 | 5 | 4 |
| 13 | 23 | 22 | 6.5 | 4.5 | 11 | 8 |
| 14 | 22 | 21 | 5.4 | 4.8 | 9 | 9 |
| 15 | 24 | 21 | 6.0 | 5.0 | 13 | 6 |
| 16 | 23 | 21 | 6.7 | 5.5 | 9 | 6 |
| 17 | 23 | 21 | 3.5 | 6.5 | 9 | 11 |
| 18 | 24 | 21 | 5.0 | 7.0 | 10 | 8 |
| 19 | 23 | 23 | 5.0 | 7.8 | 8 | 10 |
| 20 | 23 | 21 | 3.0 | 6.0 | 10 | 9 |
| 21 | 25 | 24 | 4.0 | 6.4 | 8 | 9 |
| 22 | 24 | 22 | 4.5 | 4.0 | 9 | 8 |
| 23 | 23 | 21 | 6.0 | 5.3 | 7 | 8 |
| 24 | 21 | 21 | 4.3 | 5.4 | 8 | 7 |
| 25 | 25 | 22 | 10.5 | 5.5 | 17 | 10 |
| 26 | 26 | 25 | 7.0 | 7.0 | 13 | 12 |
| 27 | 27 | 26 | 11.2 | 8.0 | 23 | 11 |
| 28 | 31 | 23 | 10.3 | 8.2 | 15 | 9 |
| 29 | 26 | 26 | 9.0 | 9.0 | 13 | 9 |
| 30 | 28 | 26 | 8.9 | 11.0 | 15 | 12 |
| 31 | 30 | 28 | 10.2 | 10.9 | 14 | 14 |
| 32 | 27 | 24 | 9.6 | 7.5 | 14 | 12 |
| 33 | 31 | 31 | 10.5 | 10.0 | 13 | 15 |
| 34 | 31 | 25 | 10.3 | 8.5 | 14 | 10 |
| 35 | 29 | 25 | 10.3 | 7.4 | 12 | 11 |
| 36 | 23 | 25 | 8.0 | 7.5 | 13 | 10 |
| 37 | 40 | 38 | 13.0 | 12.0 | 26 | 11 |
| 38 | 41 | 46 | 12.5 | 13.0 | 16 | 14 |
| 39 | 54 | 54 | 15.0 | 14.0 | 30 | 17 |
| 40 | 52 | 45 | 13.2 | 12.8 | 21 | 13 |
| 41 | 42 | 53 | 12.5 | 13.8 | 20 | 18 |
| 42 | 45 | 47 | 13.5 | 15.0 | 20 | 16 |
| 43 | 51 | 41 | 14.5 | 14.4 | 21 | 14 |
| 44 | 47 | 46 | 13.0 | 13.6 | 18 | 17 |
| 45 | 55 | 59 | 14.2 | 16.5 | 20 | 17 |
| 46 | 50 | 40 | 12.0 | 14.5 | 18 | 14 |
| 47 | 59 | 43 | 15.5 | 15.0 | 19 | 13 |
| 48 | 36 | 45 | 12.5 | 14.0 | 16 | 17 |
| 49 | 57 | 56 | 13.4 | 14.9 | 35 | 18 |
| 50 | 56 | 70 | 16.5 | 13.7 | 26 | 20 |
| 51 | 77 | 85 | 16.5 | 15.5 | 46 | 19 |
| 52 | 74 | 70 | 14.0 | 15.2 | 35 | 18 |
| 53 | 54 | 82 | 14.6 | 15.3 | 27 | 23 |
| 54 | 66 | 73 | 16.0 | 16.7 | 37 | 21 |
| 55 | 80 | 61 | 18.3 | 15.7 | 31 | 19 |
| 56 | 72 | 68 | 16.2 | 16.8 | 32 | 24 |
| 57 | 91 | 86 | 17.2 | 18.3 | 31 | 22 |
| 58 | 73 | 56 | 14.5 | 17.3 | 28 | 20 |
| 59 | 86 | 63 | 17.4 | 18.2 | 28 | 18 |
| 60 | 51 | 67 | 14.3 | 16.0 | 23 | 21 |
T-Test for the weight of lettuce for both system A and B
H0: There is no significant difference between the means of the weight for both lettuce from system A and B .
H1: There is a significant difference between the means of the weight for both lettuce from system A and B .
P-value calculated : 0.153961112
P-value calculated is more than the alpha value which is 0.05 which indicates that the null hypothesis, H0 is accepted , there is no significant difference between the means of the weight for both lettuce from system A and B.
T-Test for the height of lettuce for both system A and B
H0: There is no significant difference between the means of the height for both lettuce from system A and B .
H1: There is a significant difference between the means of the height for both lettuce from system A and B .
P-value calculated : 0.969899
P-value calculated is more than the alpha value which is 0.05 which indicates that the null hypothesis, H0 is accepted , there is no significant difference between the means of the height for both lettuce from system A and B.
T-Test for the leave number of lettuce for both system A and B
H0: There is no significant difference between the means of the leave number for both lettuce from system A and B .
H1: There is a significant difference between the means of the leave number for both lettuce from system A and B .
P-value calculated : 0.00000017
P-value calculated is less than the alpha value which is 0.05 which indicates that the alternative hypothesis, H1 is accepted , there is a significant difference between the means of the leave number for both lettuce from system A and B.
Table 2 average mean for all the weekly measurements of the lettuce
| Weight (g) | Height (cm) | Leaf Number | ||||
| Row A | Row B | Row A | Row B | Row A | Row B | |
| 1st week | 21.2 | 19.2 | 3.2 | 2.8 | 6 | 5 |
| 2nd week | 23.2 | 21.6 | 5.0 | 5.7 | 9 | 8 |
| 3rd week | 27.8 | 25.5 | 9.7 | 8.4 | 15 | 11 |
| 4th week | 47.7 | 46.4 | 13.5 | 14.1 | 20 | 15 |
| 5th week | 69.8 | 69.8 | 15.7 | 16.1 | 32 | 20 |

Figure 2 line graph showing the average mean of the plant weight for the 5 weeks for both systems
Based on the graph displayed, it is apparent that the lettuces cultivated in System A, which utilizes organic fertilizer, initially exhibit greater weight compared to the lettuces grown in System B. However, over time, this weight disparity gradually diminishes, and ultimately, both groups converge to attain an equivalent average weight by the time of harvesting.

Figure 3 line graph showing the average mean of the plant height for the 5 weeks for both systems
The graph clearly illustrates that the lettuce plants in System A initially exhibit greater height than those in System B, particularly around the third week of growth. However, as time progresses, the height of the lettuce plants in System A levels off and appears to reach a plateau. Interestingly, by the time of harvesting, the lettuce plants in System B have managed to attain a slightly greater height compared to those in System A.

Figure 4 line graph showing the average mean of the leave number of the lettuces for the 5 weeks for both systems
The graph provides a clear visual indication that the lettuce plants cultivated in System A, which incorporates organic fertilizer, consistently display a higher number of leaves when compared to the lettuce plants in System B. The disparity between these two groups of vegetables is quite pronounced. In particular, the lettuce plants in System A eventually reach an average leaf count of approximately 31 leaves, whereas the lettuce plants in System B only manage to achieve an average leaf count of around 20 leaves.
DISCUSSION
Based on the data presented, it can be concluded that there is a subtle distinction between lettuce plants grown using organic fertilizers and those cultivated with synthetic fertilizers.The lettuce plants nurtured with organic fertilizers tend to have shorter stature but boast a higher leaf count in comparison to their counterparts grown with synthetic fertilizers. This indicates that while organic fertilizers may result in smaller plants, they compensate by yielding more leaves.
Besides, both sets of lettuce plants, whether cultivated with organic or synthetic fertilizers, appear to yield similar weights at the time of harvesting. This suggests that the choice of fertilizer does not substantially impact the overall weight of the lettuce. A notable discovery is that lettuces cultivated with organic fertilizers tend to possess a sweeter taste, while those grown with synthetic fertilizers may exhibit a more bitter flavor profile. This taste disparity is attributed to the potential overabundance of certain nutrients associated with chemical fertilizers, which can lead to bitterness in vegetables(Thomas, 2023).Another facts to take note is that It's essential to acknowledge that lettuces grown with organic fertilizers present certain challenges, such as smaller leaves and a softer plant texture. In contrast, lettuce nurtured with synthetic fertilizer is characterized by a crunchier and firmer texture. Another observable distinction lies in the coloration of the lettuce. Lettuce grown with synthetic fertilizer typically displays a lighter green hue and a fresher appearance, whereas lettuce cultivated with organic fertilizer tends to exhibit a darker green color and may not appear as fresh.
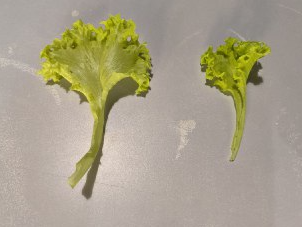
Figure 5 the difference in the size of the leaves growing from synthetic fertilizer(left) and organic fertilizer (right)

Figure 6 the difference in the overall size and color of the lettuces growing from synthetic fertilizer(left) and organic fertilizer (right)
In addition to its other attributes, an intriguing discovery is that CityFarm's organic fertilizer incorporates seaweed extract. This extract is derived from various brown seaweeds, including Sargassum, Laminaria, and Ascophyllum, and it boasts not only essential macro and micro nutrients, vitamins, and antibiotics but also a medley of growth hormones like auxin, gibberellin, cytokinin-kinetin, and cytokinin-zeatin. These growth hormones, richly present in seaweed extract, play a pivotal role in promoting plant growth by facilitating processes such as increased production, enhanced protein synthesis, cell division, and differentiation. Additionally, they contribute to fruit cell development and regulate overall plant growth, fostering optimal growth trajectories. Moreover, studies have demonstrated that the application of seaweed extract can augment nutrient content within leaves, ultimately leading to increased plant weight. This effect is attributed to the involvement of growth hormones in nutrient absorption and transportation processes within plants. Notably, seaweed extract also contains growth hormones like indole-3-acetic acid (IAA) and cytokinins, organic compounds known for stimulating growth through mechanisms such as protein synthesis, cell division, and nutrient metabolism. These findings underscore the multifaceted benefits of seaweed extract as an organic fertilizer, promoting robust plant growth and bolstering crop production (Yusuf et al.,2021) .
REFERENCES
R Yusuf et al 2021 IOP Conf. Ser.: Earth Environ. Sci. 828 012011
Sánchez, E. (2023). Hydroponics Systems and Principles Of Plant Nutrition: Essential Nutrients, Function, Deficiency, and Excess. Retrieved from https://extension.psu.edu/hydroponics-systems-and-principles-of-plant-nutrition-essential-nutrients-function-deficiency-and-excess
Thomas, R. (2023, May 7). 5 Reasons Organic Fertilizers Grow Better Vegetables. Dengarden. https://dengarden.com/gardening/Best-Garden-Fertilizer-For-Vegetables#:~:text=Chemical%20fertilizers%20can%20lead%20to,bland%20or%20bitter%2Dtasting%20vegetables.
- Tan Weng Hui (UM)
![[ArtIcle] Urban Farming: Opportunities and Challenges](http://cityfarm.my/cdn/shop/articles/WhatsApp_Image_2023-05-18_at_14.53.55_1400x.jpg?v=1684392966)
[ArtIcle] Urban Farming: Opportunities and Challenges
Traditionally, urban societies employed a variety of methods to cultivate food crops in their yards. Malaysian Agricultural Research and Development Institute (MARDI) and the Department Of Agriculture (DOA)'s introduction of innovative technology has enticed urban residents to adopt and utilize them in their home gardens or community farms. Aquaponics, aeroponics, hydroponics, and vertical farming are Malaysian communities' four most prevalent urban gardening technologies. Aquaponics is a technique that combines traditional aquaculture (raising fish and crayfish in tanks) and hydroponics (growing plants in water) in a symbiotic environment. Hydroponics and fertigation use nearly identical techniques to ensure that nutrients or fertilizers are delivered directly to the roots of the plants, hence preventing root infections. Hydroponics is one of the most popular techniques for quick and simple farming. Crops planted vertically are referred to as vertical farming. More crops can be grown on a smaller amount of land with this strategy. This means that more food can be produced with less land at the same time it opens many windows for urban citizens.
- Putera Muhammad Hazwan Hakim Bin Hamzah (UniSZA)
![[Article] The Future of Indoor Vertical Farming](http://cityfarm.my/cdn/shop/articles/11_ce4d60df-c15d-4168-9051-811d2f2db016_1400x.png?v=1670699733)
[Article] The Future of Indoor Vertical Farming
The future of indoor vertical farming looks bright, as this innovative method of growing crops continues to gain popularity and develop new technologies. Indoor vertical farming offers numerous benefits over traditional outdoor farming methods, including the ability to grow crops in urban areas, reduced water usage, and the ability to grow a wider variety of crops. As the world's population continues to grow and urbanization increases, the demand for fresh, local produce will only continue to rise, making indoor vertical farming an increasingly important part of the global food system.
One of the key developments that will shape the future of indoor vertical farming is the increased use of automation and data analytics. As indoor vertical farms become larger and more complex, automation will play a crucial role in managing and optimizing the growing process. For example, sensors and other technologies will be used to monitor and control factors such as temperature, humidity, and lighting, allowing for precise control over the growing environment. Data analytics will also be used to analyze vast amounts of data collected from sensors and other sources, helping farmers to make more informed decisions and improve their operations.

Another important factor that will shape the future of indoor vertical farming is food security. As the global population continues to grow, there will be increasing pressure on the world's food supply, and indoor vertical farming will play a crucial role in meeting this demand. Indoor vertical farms can produce fresh, healthy food even in areas where traditional outdoor farming is not possible, such as in cities and other urban areas. This will help to ensure that people have access to the food they need, even in regions where outdoor farming is not feasible.

The future of indoor vertical farming will also be shaped by advances in lighting technology. As we continue to develop new and more efficient lighting systems, indoor vertical farmers will be able to grow more diverse and nutritious crops, even in areas where sunlight is limited. For example, new LED lighting systems will allow farmers to simulate the natural light spectrum, providing plants with the specific wavelengths of light they need to thrive. This will help to improve crop yields and reduce the energy consumption of indoor vertical farms.

Finally, the future of indoor vertical farming will be influenced by advances in our understanding of plant biology and agriculture. As we continue to learn more about how plants grow and thrive, we will be able to develop new growing techniques and strategies that will allow us to grow even more diverse and nutritious crops in indoor vertical farms. This will help to further improve the sustainability and efficiency of indoor vertical farming, and will allow us to produce even more healthy, delicious food for people around the world.
Overall, the future of indoor vertical farming looks bright and full of promise. As technology continues to advance and our understanding of plant biology grows, indoor vertical farming will become an even more important part of the global food system, helping to feed a growing population and provide access to fresh, healthy produce in urban areas.
The contents of this article is generated by AI
- ChatGPT & DALL·E 2
![[Research] The Effect of Water Temperature on Plant Growth](http://cityfarm.my/cdn/shop/articles/11_43_1400x.png?v=1653919657)
[Research] The Effect of Water Temperature on Plant Growth
Introduction
The growth and development of plants can be influenced by water temperature in hydroponic cultivation. The physiological process of plants will be affected by the plant metabolic activities such as phenolic compounds, nutrient uptake, chlorophyll pigment formation, and photosynthesis. (Nxawe et al., 2011). The main function of plant roots is to absorb water and nutrients from the growing medium and later conduct them to the stem of the plant. Thus, besides electrical conductivity value, pH value and environment temperature, regulating water temperature is a crucial part in hydroponic cultivation because the temperature in the root zone may make a notable difference in plant growth.
- Lee Shen Ni (UPM)

![[Research] The Effect of Synthetic Fertilizer and Organic Fertilizer on Plant Growth (Green ribbon)](http://cityfarm.my/cdn/shop/articles/11_69_300x.png?v=1696511389)
![[ArtIcle] Urban Farming: Opportunities and Challenges](http://cityfarm.my/cdn/shop/articles/WhatsApp_Image_2023-05-18_at_14.53.55_300x.jpg?v=1684392966)
![[Article] The Future of Indoor Vertical Farming](http://cityfarm.my/cdn/shop/articles/11_ce4d60df-c15d-4168-9051-811d2f2db016_300x.png?v=1670699733)
![[Research] The Effect of Water Temperature on Plant Growth](http://cityfarm.my/cdn/shop/articles/11_43_300x.png?v=1653919657)