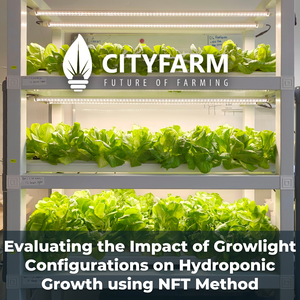
Evaluating the Impact of Growlight Configurations on Hydroponic Growth using NFT Method

Experiment Title
Evaluating the Impact of Growlight Configurations on Hydroponic Growth using NFT Method
Objective
To investigate the effects of different growlight configurations on the growth of plants in hydroponics using the Nutrient Film Technique (NFT) method.
Hypothesis
Increasing the number of growlights in conjunction with NFT channels will positively impact plant growth compared to the control group
Materials
- 4ft T8 LED growlights (Power: 25W)
- 4ft NFT channels (capable of hosting 8 plants each)
- Hydroponic nutrient solution
- Deangelia RZ lettuce seedlings
- Timer
- Measuring instruments (for growth metrics such as height, leaf count, and biomass)
- Data recording sheets
Experimental Setup
1. Control Group (C):
- Two units of 4ft growlights and two units of 4ft NFT channels.
- Growlights are set to operate for 12 hours per day.
2. Test 1 Group (T1):
- Two units of 4ft growlights and three units of 4ft NFT channels.
- Growlights are set to operate for 12 hours per day.
3. Test 2 Group (T2):
- Two units of 4ft growlights and three units of 4ft NFT channels.
- Growlights are set to operate for 18 hours per day.
|
Group |
Total plants |
Power (Wh) per day |
Power (Wh) per plant per day |
|
Control (C) |
16 |
600 |
37.50 |
|
Test 1 (T1) |
24 |
600 |
25.00 |
|
Test 2 (T2) |
24 |
900 |
25.00 |


Experimental setup, from top to bottom: Control group, Test 1 group and Test 2 group.
Experimental procedure
1. The NFT channels were prepared according to manufacturer instructions and filled with hydroponic nutrient solution.
2. The lettuce seedlings were planted in the NFT channels with consistent spacing and placement.
3. The growlights were installed at an optimal height above the NFT channels to provide uniform light distribution.
4. Timers were set up to regulate the light cycles for each group as per the experimental conditions.
5. Environment conditions such as temperature, humidity, and nutrient levels were monitored and maintained throughout the experiment to ensure consistency.
6. Plant height, leaf count, and biomass of lettuce were measured and recorded weekly for each group.
7. Visual inspections were conducted to check for any signs of stress, nutrient deficiencies, or other abnormalities in plant growth.
8. Measurements and observations were repeated weekly over the duration of the experiment.
Data Analysis
- Average
- Average height
|
|
Week 1 |
Week 2 |
Week 3 |
Week 4 |
Week 5 |
Week 6 |
|
C |
3.83 |
4.97 |
6.60 |
10.33 |
13.79 |
14.73 |
|
T1 |
4.17 |
4.79 |
7.21 |
11.50 |
14.47 |
15.66 |
|
T2 |
4.03 |
5.10 |
7.04 |
11.37 |
15.02 |
18.87 |

- Average leaf count
|
|
Week 1 |
Week 2 |
Week 3 |
Week 4 |
Week 5 |
Week 6 |
|
C |
4.94 |
9.25 |
13.31 |
18.81 |
24.75 |
32.81 |
|
T1 |
5.08 |
8.83 |
13.21 |
19.21 |
25.46 |
31.54 |
|
T2 |
5.08 |
9.21 |
13.67 |
22.25 |
31.17 |
40.58 |

- Average biomass
|
|
Week 1 |
Week 2 |
Week 3 |
Week 4 |
Week 5 |
Week 6 |
|
C |
15.88 |
18.56 |
22.50 |
34.50 |
53.81 |
85.00 |
|
T1 |
15.54 |
19.08 |
23.21 |
35.92 |
55.08 |
78.50 |
|
T2 |
15.83 |
20.00 |
26.63 |
47.29 |
73.92 |
115.50 |

- ANOVA
The tables below shows whether there are significant differences between the groups, which are determined by using ANOVA and pos-hoc test.
- Height between groups
|
|
Week 1 |
Week 2 |
Week 3 |
Week 4 |
Week 5 |
Week 6 |
|
C vs T1 |
no |
no |
no |
yes |
yes |
yes |
|
T1 vs T2 |
no |
no |
no |
no |
no |
yes |
|
T2 vs C |
no |
no |
no |
no |
yes |
yes |
- Leaf count between groups
|
|
Week 1 |
Week 2 |
Week 3 |
Week 4 |
Week 5 |
Week 6 |
|
C vs T1 |
no |
no |
no |
no |
no |
no |
|
T1 vs T2 |
no |
no |
no |
yes |
yes |
yes |
|
T2 vs C |
no |
no |
no |
yes |
yes |
yes |
- Biomass between groups
|
|
Week 1 |
Week 2 |
Week 3 |
Week 4 |
Week 5 |
Week 6 |
|
C vs T1 |
no |
no |
no |
no |
no |
no |
|
T1 vs T2 |
no |
yes |
yes |
yes |
yes |
yes |
|
T2 vs C |
no |
yes |
yes |
yes |
yes |
yes |
Observation and Discussion
- Impact on height
From week 1 to week 3, there is no significant difference in height between the groups. Starting from week 4 until week 6, Test 1 group (three NFT channels) is significantly taller than Control group (two NFT channels). The reduced spacing between NFT channels decreased the power per plant per day, causing the lettuce to grow higher to compete for light. On week 6, Test 1 group is 0.93cm taller than the Control group.
Test 2 group have three NFT channels, but the light duration increases from 12 hours to 18 hours per day. It is significantly taller than Test 1 group by 3.21cm on week 6. When compared to the Control group, Test 2 group is significantly taller from week 5 to week 6 by 4.14cm. This means that increasing light duration from 12 hours to 18 hours only compensate for the reduced power per plant per day up until week 4. After week 4, the 18 hours of light per day had caused early bolting in the lettuce. This can be observed in Test 2 group with noticeable longer internodal length compared to the other groups.

Lettuce in Test 2 group on week 6, the intermodal length is longer than the other groups
- Impact on leaf count
The addition of an extra NFT channel in Test 1 group does not result in any significant difference in leaf count compared to Control group. On the other hand, Test 2 group with longer light duration has significantly more leaves than the other groups starting from week 4. On week 6, Test 2 group has 8 more leaves compared to Control group and 9 more leaves compared to Test 1 group. The longer period of light for photosynthesis produces more energy and resources which results in higher leaf production. However, the leaves were showing stress symptoms, and the growth was stunted.
- Impact on biomass
There is no significant difference between the biomass of the Control group and Test 1 group. Test 2 group is significantly heavier than both the Control group and Test 1 group since week 2. At week 6, Test 2 group is 30.5g heavier than Control group and 37g heavier than Test 1 group. The longer light duration resulted in more production of energy by photosynthesis and accumulation of resources.

Condition of lettuce on week 6,
Test 2 group at the bottom level is noticeably larger compared to the other groups
- Abnormalities in plant growth
In the graph of average height, the trend shows that the height of lettuce in Test 2 group increase steadily while Control and Test 1 group follows sigmoid growth curve. The height anomaly in Test 2 group is likely due to 18 hours of light per day instead of 12 hours which caused the lettuce to bolt early on week 5. Test 2 group also started to show stress symptoms from week 3. The observed stress symptoms are tip burns, leaf curling and thickening and stunted growth of leaf blade.


Stress symptoms observed in Test 2 group on week 3 (left) and week 5 (right).
Conclusion
Comparing Test 1 group with Control group, adding an NFT channel significantly increases lettuce height by 0.93cm. However, it does not make any significant difference in terms of leaf count and biomass. The growlight configuration in Test 1 group does not causes any visual difference compared to the Control group.
Comparing Test 2 group with Control group, increasing light duration from 12 hours to 18 hours per day significantly increase the height of lettuce by 4.14cm and caused early bolting. It also increases the leaf count by 9 and increases the biomass by 37g but with severe stress symptoms and stunted growth of the leaves. The growlight configuration in Test 2 group resulted in lettuce that are not aesthetically pleasing which reduces its market value.
In conclusion, increasing the number of growlights in conjunction with NFT channels will negatively impact plant growth compared to the control group.
Implications for optimizing hydroponic systems and suggest potential areas for further research
Firstly, this experiment revealed that while increasing the number of NFT channels (Test 1) did not notably affect lettuce leaf count and biomass compared to the control group, extending the light duration (Test 2) from 12 to 18 hours per day significantly enhanced plant height, leaf count, and biomass. These findings underscore the significant role of light duration in optimizing growth metrics, although prolonged exposure to light (18 hours) also resulted in early bolting and stress symptoms in the plants. Hence, further research is needed to explore optimal light intensities and durations tailored to specific plant species and growth stages in hydroponics. This may involve investigating dynamic lighting strategies or variable light schedules to effectively manage stress and further optimize growth conditions.
Next, in terms of power consumption efficiency, both Test 1 and Test 2 groups maintained the same power per plant per day, although Test 2 consumed more total power due to extended light durations. This underscores the critical need for efficiency in power consumption as hydroponic operations scale up. So, for further research should explore energy-efficient lighting solutions and their influence on growth parameters. This could involve optimizing LED spectrums tailored to different plants' specific needs and integrating smart lighting controls to adjust intensity and duration dynamically. These advancements could enhance productivity while minimizing energy costs, contributing to sustainable and economically viable hydroponic farming practices.
Besides, the Test 2 group in the experiment displayed evident stress symptoms including tip burns, leaf curling, and stunted growth, attributed to prolonged exposure to light. Despite observing higher biomass and leaf count, these benefits came at the expense of compromised aesthetic quality and market value of the lettuce. Thus, further research is essential to develop effective strategies for managing plant stress under prolonged light exposure. Potential approaches could include supplementing with stress-relief nutrients or optimizing the light spectrum to mitigate photoinhibition. These efforts aim to sustain plant health and enhance overall crop quality in hydroponic systems, addressing the challenges posed by extended light durations on plant physiology and marketability.
- Chai Wen Lin (UPM), Ngu Iee Ling (UPM)
![[Research] The Effect of Synthetic Fertilizer and Organic Fertilizer on Plant Growth (Green ribbon)](http://cityfarm.my/cdn/shop/articles/11_69_300x.png?v=1696511389)
![[ArtIcle] Urban Farming: Opportunities and Challenges](http://cityfarm.my/cdn/shop/articles/WhatsApp_Image_2023-05-18_at_14.53.55_300x.jpg?v=1684392966)
![[Article] The Future of Indoor Vertical Farming](http://cityfarm.my/cdn/shop/articles/11_ce4d60df-c15d-4168-9051-811d2f2db016_300x.png?v=1670699733)
![[Research] The Effect of Water Temperature on Plant Growth](http://cityfarm.my/cdn/shop/articles/11_43_300x.png?v=1653919657)