[Research]Grow Light Experiment with Lollo Bionda
![[Research]Grow Light Experiment with Lollo Bionda](http://cityfarm.my/cdn/shop/articles/Open_Sans_Extra_Bold_32_1_1024x.png?v=1577970855)
HORTICULTURE GROW LIGHT EXPERIMENT
I was assigned to conduct a light experiment for salad plants to observe and figure out the lights with best performance towards plant in terms of plant’s weight, height, number of leaves and appearance. There are 5 types of artificial lights will be used in this experiment.
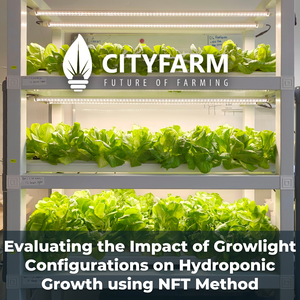
The model of hydroponic farm system used is the Zig-zag Vertical Farm, there are 6 NFT channels in total, I am using only five of them. To ensure that the lights do not interfere with each other, the middle space is covered with polystyrene boards. The plants used in this experiment are Lollo Bionda, one type of coral salad. The seeds are germinated in sponge before used and been transplanted into the Zig-zag Vertical Farm at the age of 2 weeks old, they are germinated and transplanted at the exact same time to ensure the reliability of this experiment.
Aims:
- To figure out the best lights for plant growth out of the five lights been experimented.
- ‘different light wavelength’ and ‘light intensity’
Materials and methods:
- Lollo Bionda plantlets (2 weeks old, sponge as media),
- Zig-zag Vertical Farm,
- 5 types of lights,
- Hydroponic fertilizer as nutrients supply (been maintained within 600 to 700ppm throughout the experiment)

Figure 4: Zig-zag Vertical Farm (model of hydroponic system been used in this experiment)
Table 1: Information of lights in the experiment.
|
Light 1: Power:22W PPF: 35 μMol/s PPFD at 22cm: 95 μmol/m2/s LED quantity: 73pcs Length:1200mm LED: Purple |
Light 2: Power:18W PPF: - PPFD at 22cm: 70 μmol/m2/s LED quantity: 120pcs Length:1200mm LED: Red and Blue |
Light 3: Power:18W PPF: - PPFD at 22cm: 110 μmol/m2/s LED quantity: 96pcs Length:1200mm LED: Full Spectrum |
|
Light 4: Power:18W PPF: 32.4μMol/s PPFD at 22cm: 107 μmol/m2/s LED quantity: 120pcs Length:1200mm LED: Purple |
Light 5: Power:30W PPF: 66μMol/s PPFD at 22cm: 210 μmol/m2/s LED quantity: 175pcs Length:1100mm LED: Full spectrum |
|
RESULT
Week 1 - Data of light experiment.
Table 1: Wet weight of the plants, which weight of net pot is not included. (weight of net pot = 2.4g). The weighing machine was calibrated before used to remove the weight of net pot.
|
Lights |
Plant’s wet weight (g) |
Total weight gain (Week 5 – Week 1) |
||||
|
Week 1 |
Week 2 |
Week 3 |
Week 4 |
Week 5 |
||
|
1 |
8.67 |
10.52 |
15.95 |
27.95 |
47.00 |
38.33 |
|
2 |
9.93 |
12.30 |
18.40 |
33.50 |
59.22 |
49.29 |
|
3 |
8.33 |
10.00 |
15.63 |
29.90 |
58.68 |
50.35 |
|
4 |
8.27 |
10.98 |
17.87 |
34.65 |
63.02 |
54.75 |
|
5 |
7.90 |
11.53 |
25.07 |
59.05 |
115.37 |
107.47 |
Table 2: Height of the plant, only parts above the germination sponge are measured.
|
Lights |
Plant’s height (cm) |
Total height gain (Week 5 – Week 1) |
||||
|
Week 1 |
Week 2 |
Week 3 |
Week 4 |
Week 5 |
||
|
1 |
7.55 |
10.80 |
14.92 |
19.12 |
23.30 |
15.75 |
|
2 |
7.70 |
9.62 |
13.95 |
18.73 |
23.15 |
15.45 |
|
3 |
7.05 |
9.60 |
13.00 |
17.02 |
21.17 |
14.12 |
|
4 |
7.97 |
10.18 |
13.92 |
18.90 |
23.85 |
15.88 |
|
5 |
7.78 |
8.88 |
12.75 |
17.42 |
20.43 |
12.65 |
Table 3: Number of leaves.
|
Lights |
Number of Leaves |
Total leaves gain (Week 5 – Week 1) |
||||
|
Week 1 |
Week 2 |
Week 3 |
Week 4 |
Week 5 |
||
|
1 |
5.12 |
7.3 |
8.67 |
10.33 |
14.83 |
9.71 |
|
2 |
5.00 |
6.83 |
9.50 |
10.50 |
14.17 |
9.17 |
|
3 |
5.00 |
6.83 |
9.50 |
10.50 |
14.83 |
9.83 |
|
4 |
5.00 |
6.83 |
9.83 |
10.67 |
15.00 |
10 |
|
5 |
5.00 |
7.17 |
9.17 |
11.83 |
18.33 |
13.33 |


Overall observation of plants’ appearance:
Light 1- Lengthy stems, slim leaves with scattering pattern.
Light 2- Lengthy stems, leaves broader than plants under light 1, scattering leaves.
Light 3- Lengthy stems, slim leaves with scattering pattern, similar appearance with plants under light 2.
Light 4- Lengthy stems, slim leaves with scattering pattern, heavier wet weight compared to row 1,2 and 3.
Light 5- Broad leaves, bushy, with heaviest weight and has highest amount of leaves compared
to plants under other lights.
Weight comparison:
Figure 15: weight comparison graph for plants under different lights over 5 weeks.
Height comparison:
Figure 16: height comparison graph for plants under different lights over 5 weeks.
Number of leaves comparison:
Figure 17: number of leaves comparison graph for plants under different lights over 5 week
Table 17: General view on the Lollo Bionda in the experiment under different lights.


DISCUSSION
Plants under light 5 has the most satisfying output which has heaviest weight, moderate height and highest number of leaves compared to others. Light 5 illustrate the best performances among the lights been tested, which suggested that full spectrum light might be more suitable in supporting overall plant growth.
Light 3 which is full spectrum as well do not perform the same as light 5 might because of the strength of power.
Plants under light 1, 2 and 4 (purple or red and blue lights) shows a similar symptom which is elongated stem, this might due to the effect of red light, which support stem elongation process or low intensity of light due to low power output of the lights. Besides, a high relative content of blue light could reduce the plant leaf area, this explained the slim leaves appearances in the plants under light 1,2 and 4. These observations suggested that red and blue light has moderate or undesirable effects on lettuce growth such as elongated stem and slim leaves.
Suggestions or recommendation:
- Use lights with same power output to eliminate the effect brings by other factor such as light intensity.
- Carry out this experiment in dark environment which do not get affected by other light sources.
CONCLUSION
Full spectrum light is suggested to be the most suitable light source for plant growth based on the performance on plant’s weight, height and appearance. Light 3 and 5 are both full spectrum the differences showed in their performance might due to the difference in power output.
- Xin Wei Lee


![[Research] The Effect of Synthetic Fertilizer and Organic Fertilizer on Plant Growth (Green ribbon)](http://cityfarm.my/cdn/shop/articles/11_69_300x.png?v=1696511389)
![[ArtIcle] Urban Farming: Opportunities and Challenges](http://cityfarm.my/cdn/shop/articles/WhatsApp_Image_2023-05-18_at_14.53.55_300x.jpg?v=1684392966)
![[Article] The Future of Indoor Vertical Farming](http://cityfarm.my/cdn/shop/articles/11_ce4d60df-c15d-4168-9051-811d2f2db016_300x.png?v=1670699733)
![[Research] The Effect of Water Temperature on Plant Growth](http://cityfarm.my/cdn/shop/articles/11_43_300x.png?v=1653919657)